Calibration gaps without profit claims
Read declared group fractions without confusing a descriptive gap, forecast loss or independent trading calibration.
A group fraction is observed on its own table
The positive fraction in group A is its positive-label count divided by its observation count. Comparing that fraction with the group's constant declared probability produces an absolute gap. Weight each group's gap by its number of observations and divide by the total to form the lens's weighted absolute declared-group gap. The group definitions are input declarations, not learned or automatically sorted probability bins. Different definitions can change the descriptive quantity. Report them alongside the result. The tool does not choose bin edges, smooth frequencies or claim that the groups are independent samples.
A zero gap does not remove finite-sample uncertainty
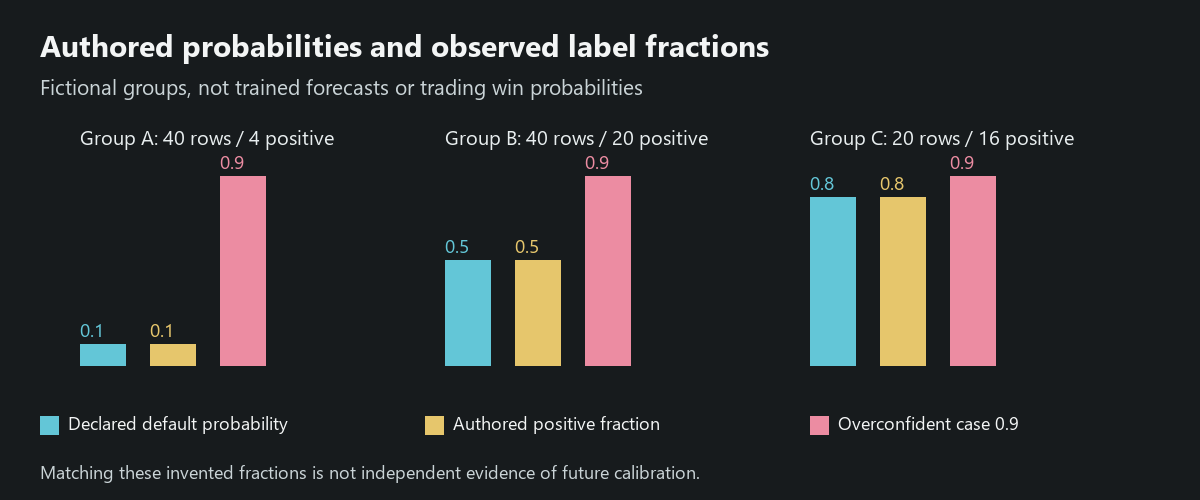
The default authored labels are chosen to match their constant probabilities exactly within each group. Its zero descriptive gap is therefore an arithmetic feature of an invented packet, not evidence that a trained model is calibrated in future markets. Even a real group matching its forecast frequency can have few observations, dependence, selection or an unrepresentative period. This lens estimates no confidence intervals. It does not assume that a hundred consecutive decisions are independent draws. A genuine study needs frozen forecasts and labels evaluated under their real chronology and selection policy before asserting a bounded calibration finding.
Loss is not calibration alone
Binary Brier loss scores probability error across the population. Its movement can reflect more than calibration, so a lower loss cannot by itself demonstrate a better calibration relationship. Our group-gap calculation is a separate descriptive quantity, with its own declared grouping. Keep both definitions visible rather than presenting either as a universal forecast grade. A forecast that always assigns one confident value can be badly mismatched to a group's observed frequency. The overconfident case exposes that mismatch using the same invented labels; it does not measure any provider's actual forecasts or calibrate its conviction tags.
No bridge to financial odds is supplied
Binary labels need their own positive-class definition. A boundary-recovery label is not automatically a profitable trade, and neither is a direction label or message grade. Actual profitability depends on action, execution, exit, quantity and costs. The probability packet deliberately has no financial outcome fields beyond null. Do not use its matching fractions to assign real odds to an unseen seller model. A future calibration layer also needs its fitted-sample boundary separate from evaluation. Learning a mapping on the very table used to praise it would consume that table's independent role.
Fictional model evidence case
The invented overconfident case changes all supplied probabilities to 0.9 while keeping forty, forty and twenty observations with four, twenty and sixteen positives. Its actual fractions remain 0.1, 0.5 and 0.8; group gaps are 0.8, 0.4 and 0.1. Weighted by group size, the overall absolute gap is 0.5. Its Brier loss is 0.49. These are exact properties of the authored labels, not a measured calibration failure of a real trader or a probability of account loss.
| Object | Record | Bounded finding |
|---|---|---|
| A | 40 rows / 4 positives | 0.9 forecast; gap 0.8 |
| B | 40 rows / 20 positives | 0.9 forecast; gap 0.4 |
| C | 20 rows / 16 positives | 0.9 forecast; gap 0.1 |
Primary references and scope
Source review: 14 October 2026. Official mechanism descriptions are not this desk's paid-account test, independently captured fills or vendor-return audit.