The same-table prevalence baseline
Explain the empirical constant-probability reference, its zero denominator and why it is not an independently frozen benchmark.
Declare where the reference comes from
The reference probability is q, the positive-label fraction of the exact entered table. It is computed after that table's labels are available. Assigning q to every row gives binary Brier loss q times one minus q. This is a convenient descriptive reference, not a forecast frozen before seeing the evaluation sample. A real benchmark could use a training-only prevalence or another predeclared prediction policy; that would need its actual frozen inputs. Do not silently substitute a same-table estimate and label it an independent out-of-sample competitor.
Relative improvement is conditional arithmetic
The displayed same-table relative Brier improvement is one minus the supplied forecast loss divided by the empirical reference loss. A positive value means lower loss than this particular reference; a negative value means higher loss. Neither is financial alpha. The denominator's label distribution can change the ratio even if other aspects of the model remain similar. Report absolute loss, reference loss, prevalence and the comparison formula together. The number has no return units and supplies no uncertainty interval. It cannot be added to a raw performance percentage or compounded into portfolio equity.
One-class populations have a boundary
When every label is negative, q is zero; when every label is positive, q is one. In either case the same-table constant reference has zero loss. Relative division by that zero is undefined, even if the entered forecasts also have zero loss. The lens exports null for relative improvement. It does not turn a zero-over-zero comparison into a perfect score. Threshold metrics retain their own undefined-denominator rules as well. These behavior checks are known software fixtures, not observations that a market model predicted every label correctly.
Do not choose a benchmark after the favorable result
A fair real comparison specifies the reference, source period, target and allowed fitting before evaluation. If a benchmark is changed after inspecting outcomes, preserve that selection history. Comparing a carefully selected predictor with an unselected or differently scoped reference can create a misleading narrative even when the arithmetic is correct. The workbook's empirical baseline is labelled same-table precisely because it does not claim that stronger design. Readers can reproduce it without mistaking the teaching comparison for an actual independently evaluated trading strategy or a competitor audit.
Fictional model evidence case
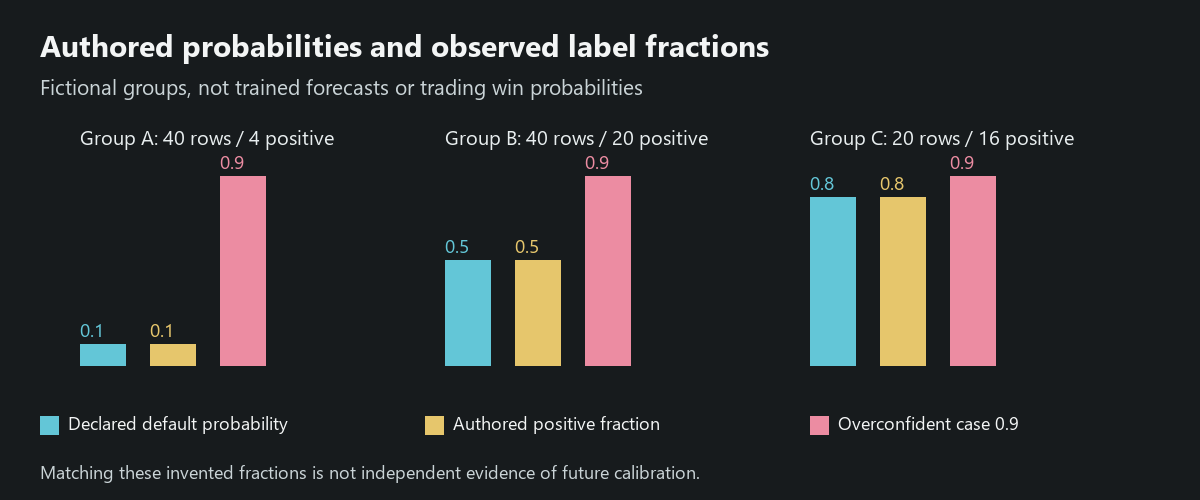
The default fictional table has forty positive labels in one hundred observations, so q is 0.4 and the reference loss is 0.24. Supplied constant group probabilities yield loss 0.168 and relative improvement 0.3. In the overconfident case loss is 0.49 and the comparison is approximately negative 1.0416667. Neither number is a return or an independently estimated probability advantage. In the all-negative zero-probability fixture both losses are zero and the relative comparison is undefined.
| Object | Record | Bounded finding |
|---|---|---|
| Default | q 0.4 / reference 0.24 | Relative comparison 0.3 |
| Overconfident | Loss 0.49 | Relative comparison about -1.0416667 |
| All negative | Reference zero | Relative comparison null |
Primary references and scope
Source review: 14 October 2026. Official mechanism descriptions are not this desk's paid-account test, independently captured fills or vendor-return audit.