Constant-probability groups and binary Brier score
Reproduce the binary probability-loss formula from exact groups without pretending that average forecasts preserve individual error.
Declare constant predictions, not group averages
Each row in a group must receive the same supplied probability for this lens's aggregate formula to be exact. Group count, positive-label count and probability define the exercise. A table showing only an average probability does not imply that every row received that average. Squared error depends on individual forecasts and their relationship to labels. If probabilities vary, retain their actual row values and calculate from that population. Three compact mean forecasts are not a substitute. The default specimen expands the constant declaration into every authored row so that this important assumption is inspectable.
Count negative and positive contributions
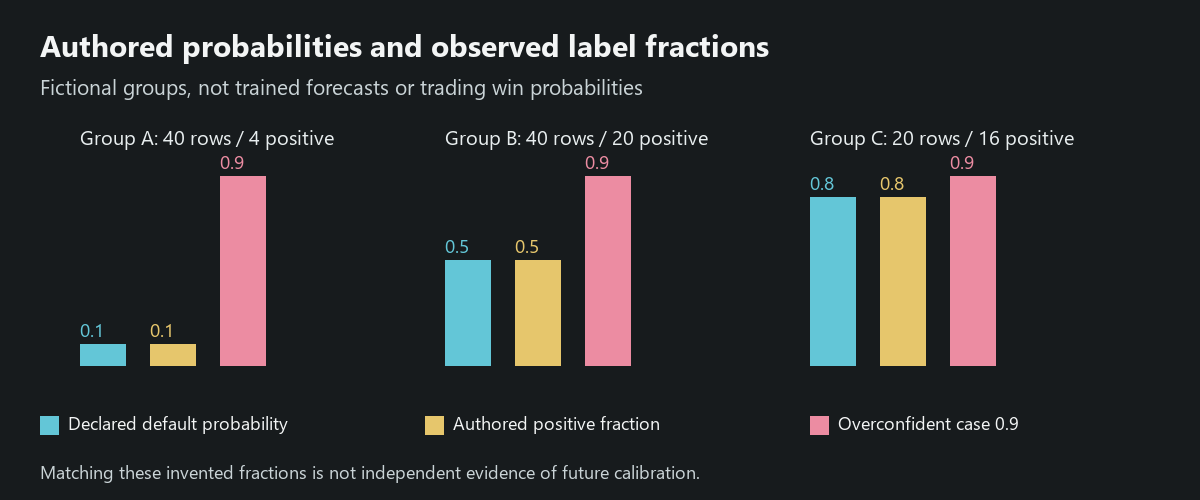
For a group with n observations, k positive labels and constant p, the negative labels contribute (n minus k) times p squared. Positive labels contribute k times (one minus p) squared. Sum these contributions over groups and divide by the total observation count. The result uses the binary zero-one Brier scale. It does not involve the action threshold. The default forty rows at 0.1, forty at 0.5 and twenty at 0.8 have four, twenty and sixteen positive labels respectively. Their combined mean squared loss is 0.168 on the declared authored population.
An empty group is not a perfect group
A zero-count group must have zero positive labels. Its observed fraction and absolute individual group gap are undefined, because there is no denominator. It contributes zero weight to the total loss and the weighted gap. The calculation still permits a declared probability for that unused group without pretending to test it. If all groups are empty, the entire result is invalid and the prior export is retired. Count inputs must be whole non-negative values, and positives cannot exceed observations. These validation rules protect arithmetic identity, not the truthfulness of an entered real-world record.
Keep the result within its forecast scope
A lower Brier loss on one supplied table says nothing about costs, payouts or account weights. It is not a probability estimate by itself, and it does not identify the model that generated the inputs. The lens performs no calibration training or classifier fit. The complete default CSV is deliberately fictional and ordered for reproduction, not chronology. Real forecasting evidence needs original probabilities, label ownership and an honest evaluation sample. Financial inference additionally needs the actual trading policy and complete accounting. A source describing a metric function supports its definition, not a claim that these authored rows validate a trading model.
Fictional model evidence case
An invented two-row group has one positive label. With both probabilities set to 0.5 its Brier loss is 0.25. Give the positive row probability 0.9 and the negative row 0.1 instead: the average probability remains 0.5 while loss becomes 0.01. Reversing those row probabilities keeps the same mean but produces 0.81 loss. Therefore average probability and class count alone cannot recover individual squared error. Our compact tool requires constant forecasts and does not accept those varying predictions as if they satisfied its contract.
| Object | Record | Bounded finding |
|---|---|---|
| Constant | 0.5 / 0.5 | Brier 0.25 |
| Aligned varying | 0.9 positive / 0.1 negative | Brier 0.01 |
| Reversed varying | 0.1 positive / 0.9 negative | Brier 0.81 |
Primary references and scope
Source review: 14 October 2026. Official mechanism descriptions are not this desk's paid-account test, independently captured fills or vendor-return audit.